Where Do People Drink The Most Beer, Wine And Spirits?

Back in 2014, fivethiryeight.com published an article on alcohol consumption in different countries. The data drinks is available as part of the fivethirtyeight package.
library(fivethirtyeight)
data(drinks)glimpse(drinks)## Rows: 193
## Columns: 5
## $ country <chr> "Afghanistan", "Albania", "Algeria", "An…
## $ beer_servings <int> 0, 89, 25, 245, 217, 102, 193, 21, 261, …
## $ spirit_servings <int> 0, 132, 0, 138, 57, 128, 25, 179, 72, 75…
## $ wine_servings <int> 0, 54, 14, 312, 45, 45, 221, 11, 212, 19…
## $ total_litres_of_pure_alcohol <dbl> 0.0, 4.9, 0.7, 12.4, 5.9, 4.9, 8.3, 3.8,…skim(drinks)| Name | drinks |
| Number of rows | 193 |
| Number of columns | 5 |
| _______________________ | |
| Column type frequency: | |
| character | 1 |
| numeric | 4 |
| ________________________ | |
| Group variables | None |
Variable type: character
| skim_variable | n_missing | complete_rate | min | max | empty | n_unique | whitespace |
|---|---|---|---|---|---|---|---|
| country | 0 | 1 | 3 | 28 | 0 | 193 | 0 |
Variable type: numeric
| skim_variable | n_missing | complete_rate | mean | sd | p0 | p25 | p50 | p75 | p100 | hist |
|---|---|---|---|---|---|---|---|---|---|---|
| beer_servings | 0 | 1 | 106.16 | 101.14 | 0 | 20.0 | 76.0 | 188.0 | 376.0 | ▇▃▂▂▁ |
| spirit_servings | 0 | 1 | 80.99 | 88.28 | 0 | 4.0 | 56.0 | 128.0 | 438.0 | ▇▃▂▁▁ |
| wine_servings | 0 | 1 | 49.45 | 79.70 | 0 | 1.0 | 8.0 | 59.0 | 370.0 | ▇▁▁▁▁ |
| total_litres_of_pure_alcohol | 0 | 1 | 4.72 | 3.77 | 0 | 1.3 | 4.2 | 7.2 | 14.4 | ▇▃▅▃▁ |
Beer Consumption
drinks %>%
  slice_max(n=25,beer_servings) %>%
  ggplot(mapping = aes(y = reorder(country,beer_servings), x = beer_servings)) +
  geom_col()+
  theme_economist()+
  labs(
    x = "Servings of beer",
    y= "" ,
    title = "Top 25 beer consuming countries",
    caption = "Source: https://fivethirtyeight.com/features/dear-mona-followup-where-do-people-drink-the-most-beer-wine-and-spirits/"
    ) +
    geom_text(aes(label = beer_servings), vjust=0.5, hjust=1, colour = "white", position = position_dodge(.9), size = 3)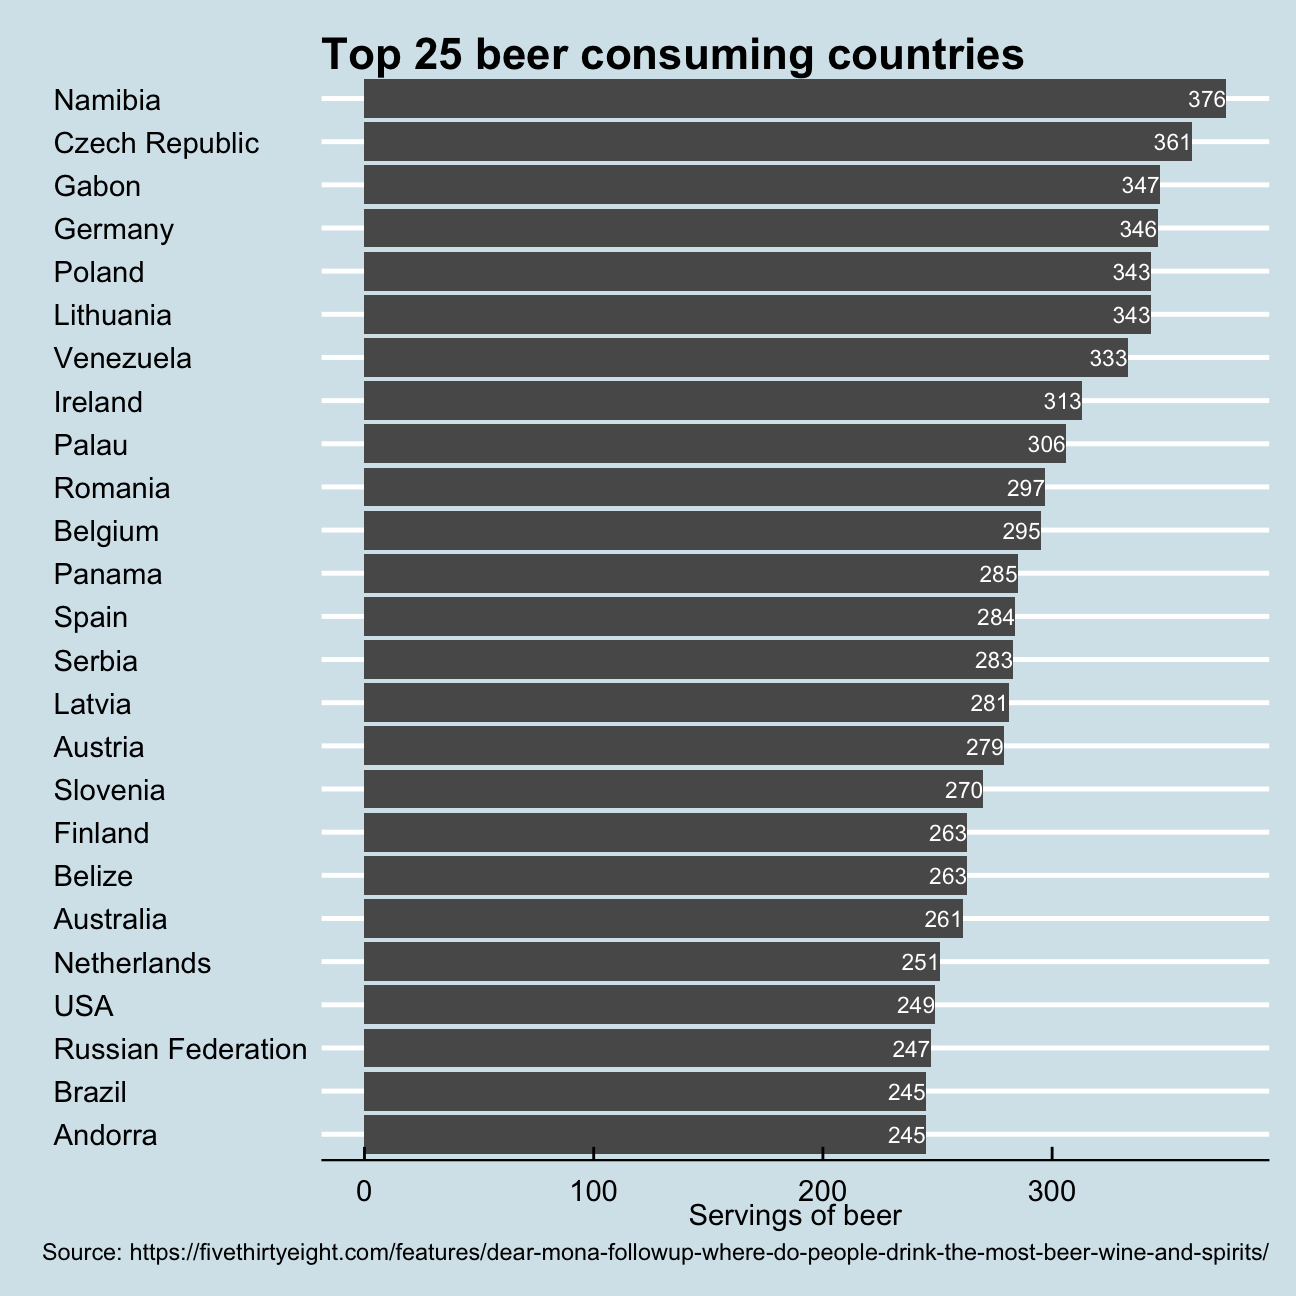
Wine Consumption
drinks %>%
  slice_max(n=25,wine_servings) %>%
  ggplot(mapping = aes(y = reorder(country,wine_servings), x = wine_servings)) +
  geom_col()+
  theme_economist()+
  labs(
    x = "Servings of wine",
    y= "" ,
    title = "Top 25 wine consuming countries",
    caption = "Source: https://fivethirtyeight.com/features/dear-mona-followup-where-do-people-drink-the-most-beer-wine-and-spirits/"
    ) +
    geom_text(aes(label = wine_servings), vjust=0.5, hjust=1, colour = "white", position = position_dodge(.9), size = 3)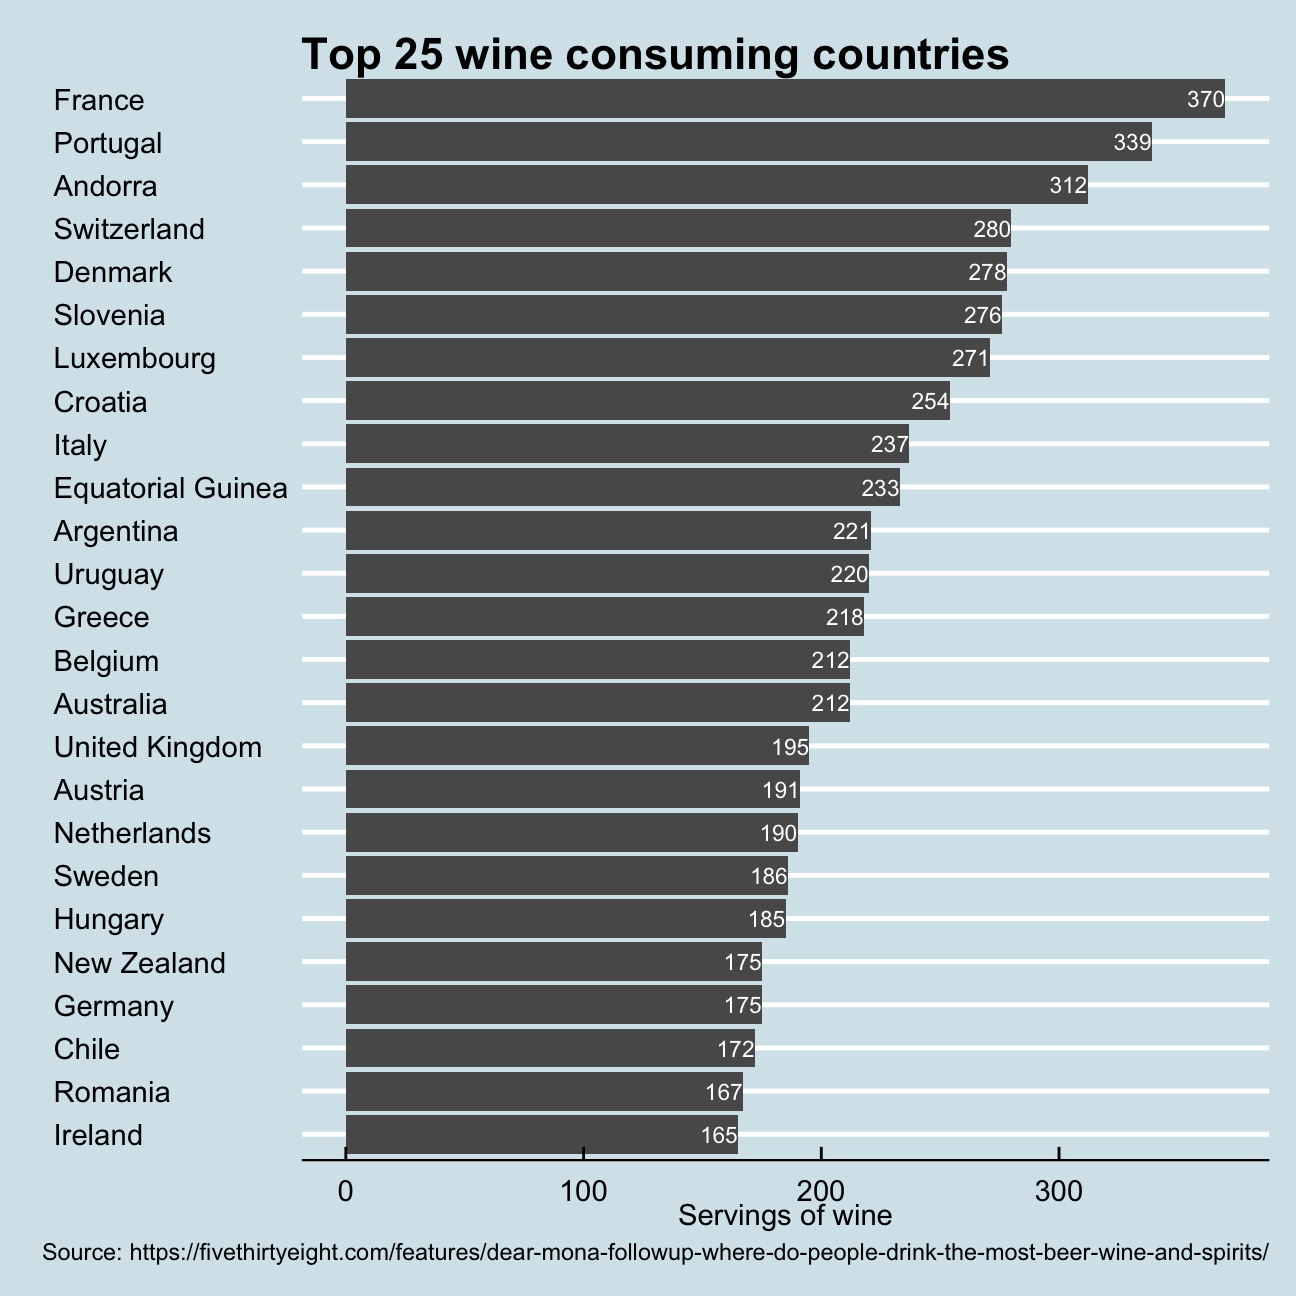
Spirit Consumption
drinks %>%
  slice_max(n=25,spirit_servings) %>%
  ggplot(mapping = aes(y = reorder(country,spirit_servings), x = spirit_servings)) +
  geom_col()+
  theme_economist()+
  labs(
    x = "Servings of spirit",
    y= "" ,
    title = "Top 25 spirit consuming countries",
    caption = "Source: https://fivethirtyeight.com/features/dear-mona-followup-where-do-people-drink-the-most-beer-wine-and-spirits/"
    ) +
    geom_text(aes(label = spirit_servings), vjust=0.5, hjust=1, colour = "white", position = position_dodge(.9), size = 3)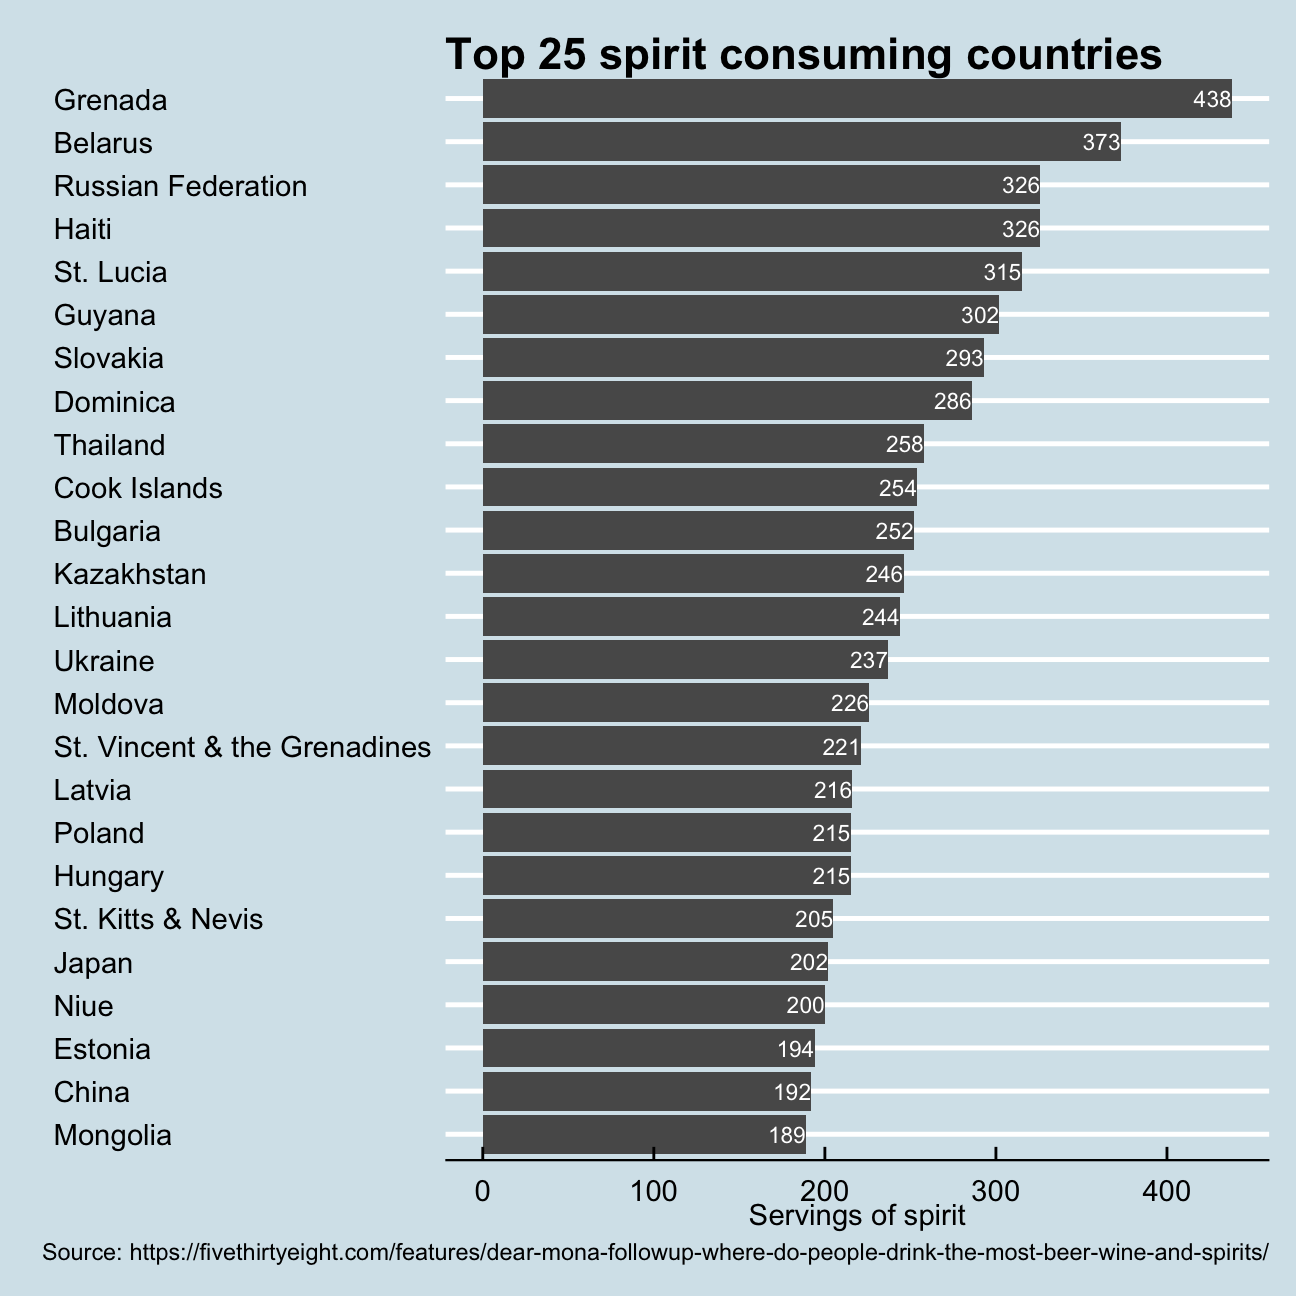
Conclusions
First of all , the top 5 countries across the three rankings (in total 15 countries) are all different from each other, and the countries that show up in more than one ranking are few and far between. This means that the drinks preference varies wildly across different countries, and usually, one country clearly prefers one kind of drink to others. For instance, beer clearly dominates countries like Germany and Czech Republic, known for their beer production and culture. Wine is also dominated by other European countries, as the top 9 wine consuming countries are European countries. Clearly the French, known for their wine regions such as Bordeaux, Alsace, Burgundy and Champagne, and low wine prices, consume far more wine than people in any other countries, 370 glasses of wine per person per year, 31 glasses more than No.2 country.
While looking at the top 25 spirit consuming countries, you find primarily Eastern European countries as well as a at first glance surprising amount of Caribbean countries (Grenada, St Lucia, St Vincent etc.), these are countries known for the production of vodka or rum. The high amount of consumption in Eastern Europe is both as result of a the poorer climate not suitable to grow grapes for example and grounded in the historic aftermath of communism, while the high amount of Caribbean countries might be a result of tourism and consumption of alcoholic beverages by vacationers
It is also interesting to consider the range between Top1 and Top25, in beer consumption that gap is smaller than with wine and spirits. This could due to the fact that beer is cheaper per glass and universally produced and consumed around the world.